
Create A Dynamic Date Table In Power Query
/Most Power BI and Power Pivot (Excel) reports require a date table so time intelligence functions can calculate correctly. I’m going to show you how to quickly set up a date table in Power Query, one that will be dynamic. The starting and ending dates will move with your data over time. And because it is in Power Query, it will be an imported table which is what Power BI loves most, being more efficient than a table created in DAX with calculated columns.
You can download the Excel sample data and Power BI file at the bottom of this article if you want to follow along step by step.
EDIT: I have a big block of M code you can use to create your own date table at this link - it is an Evernote page. The contents of this blog post though are still important is it will show you how to make that block of code dynamic.
First of all, we’ll create a static table to get the query set up, then modify it so it is dynamic. The fastest way I’ve seen to create a dates table in Power Query is to start with the one line statement shown below, which we’ll put in a Blank Query. In Power Query in Power BI, it is on the home menu, New Source, Blank Query. In Excel, it depends on the version you have.
Office 365 versions and Excel 2019:
Data tab in Excel
Get & Transform Data section of the ribbon
Get Data dropdown menu
From Other Sources
Blank Query
In Excel 2016 and earlier, you will need to open the Power Query window first. This also works in Office 365 and Excel 2019 if you are already in Power Query.
On the Home tab, select New Source
Other Sources
Blank Query
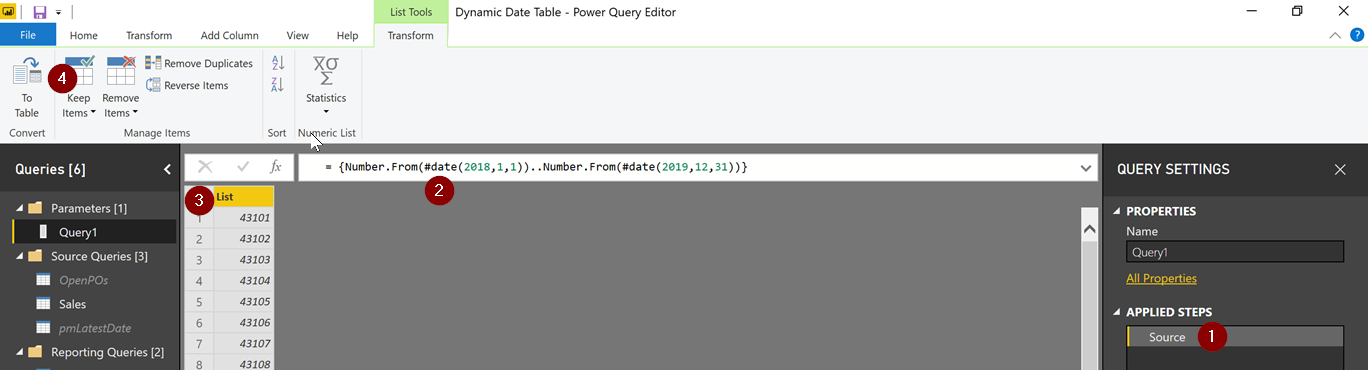
Now you have a blank query called Query1, with a Source in the applied steps (#1 in the above image), but nothing is there. In the formula bar, type the following (#2) and press enter:
={Number.From(#date(2018,1,1))..Number.From(#date(2019,12,31))}
Let’s break that down:
Lists are defined in Power Query by enclosing them in what I call squiggly brackets, but are also known as braces or curly brackets. { }
When used with numerical data, if you have two periods between the first and second number, it will generate a list of all numbers between those numbers. So {1..10} would generate a list of numbers from 1 to 10.
My first number is Number.From(#date(2018,1,1)). This returns 43101. That is the same thing You’d get in Excel if you typed 1/1/2018 in a cell, then formatted it as a number.
My second number is 43830, the numerical value of December 31, 2019.
The total list has 730 numbers, 43101 - 43830, which is two years of data. Perfect. No skipped dates.
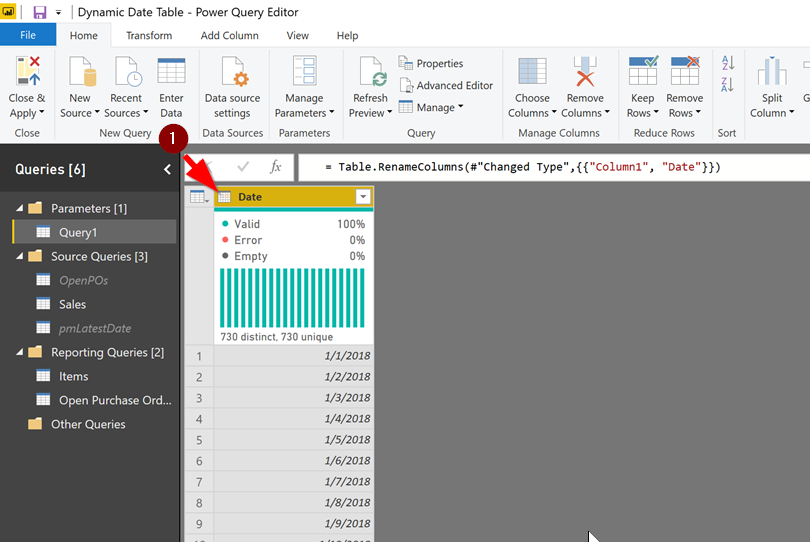
Now we need this to be a table of dates, not a list of numbers. Let’s fix that.
Click the “To Table” icon (#4) in the tool bar. In the To Table dialog box, leave the defaults of “None” for the delimiter and “Show as errors” for extra columns. There are no delimiters or extra columns here, so there won’t be any issues.
For the data type where it says ABC/123, click that and change it to Date. This is the tiny box below with the arrow pointing to it in the image below.
Rename the column to Date.
Rename the query to Date.
Right Click on the query and make sure Enable Load is checked.
At this point, it is a valid date table, but quite spartan, and it isn’t dynamic. First let’s make it dynamic so the date ranges move with your data. I’ve created some sample data that I’ll use for this. I want my date table to encompass the earliest data from my Sales table so all of my sales history is covered, and I want the latest dates in the table to handle dates in the Open Purchase Orders table, which has expected receipts of merchandise well into the future.
A couple of rules about Date tables first:
The dates must be contiguous. There can be no gaps. Even if your business doesn’t operate on the weekends or holidays, those dates cannot be missing from your table. The way the data was created using a List ensures no dates are skipped.
You should almost always include the full year for any date in your table. So if your data has Jan 1, 2019 in it, you should have all 365 days of 2019 in your date table. I am working with calendar years in this example. If you have a fiscal year, that is fine, but your data should still encompass a full fiscal year. So if your year is July 1 through June 30, if you have July 1, 2019 in your dates table, you should have all dates through June 30, 2020, a full fiscal year.
So how do we make this dynamic? We need to figure out what the earliest date is in the sales table, since that table is going to have the oldest data for sales history, and we need to know the latest date will be based on the last date in the OpenPOs table.

Right-click on the Sales table make sure “Enable Load” is not checked. You’ll see why in a minute.
Right-click again on the Sales table and select “Reference”. We now have a second query that is identical to the Sales table, because it is simply pointing to the Sales table. Any changes to the Sales table will affect this new query, which is probably called Sales (2) at this point.
Rename Sales (2) to pmEarliestDate. I recommend you put no spaces in the name as that complicates things later on.
Right-Click and ensure “Enable Load” is not checked. Not only is there no need to load this, it will create an error as lists cannot be loaded into Power BI or Power Pivot.
Select the Date column (#1 in the above image)
On the Transform tab, select Date (#2), then Earliest (#3).
Now we have the earliest date as a list. A single item list. In my sample data, it is Jan 2, 2015. Jan 1 was a holiday, so I didn’t expect any data there, but remember, I need to make this a full year, so let’s tweak the formula that was generated by Power Query.
Power Query used the List.Min() function to the earliest date. List.Min(Source[Date])
We need to extract the year first, so wrap that in Date.Year(). Now it is just 2015.
Now convert it back to a date, starting with January 2. Wrap step 2 with #date(year,1,1). The final formula is:
= #date(Date.Year(List.Min(Source[Date])),1,1)
If you were on a fiscal year, you’d need to do a bit more math to get this to July 1, 2014, for example, but still pretty easy to do. You’ve probably figured out by now that #date() is the same things as DATE() in Excel, taking year, month, and day for the arguments.
Now, we need the last date. I’ll repeat the steps above on my OpenPOs table’s date column, but instead of the Earliest date, I want the Latest date. My final formula is:
= #date(Date.Year(List.Max(Source[Expected Receipt Date])),12,31)
This will give me a date of Dec 31, 2020 since the latest date in that table is Mar 31, 2020. Note this time Power Query used the List.Max function to get the latest date in the table. Call this query pmLatestDate
Now I know my first and last date, and both are calculated dynamically. If dates in my source tables change, so to these two parameters.
So how do we make the Date table we created use these dates? Remember our original Date table started with this Source line:
={Number.From(#date(2018,1,1))..Number.From(#date(2019,12,31))}
We need to edit that formula a bit. We just get rid of the hard coded dates, and replace with our dynamically calculated dates. It becomes this:
={Number.From(pmEarliestDate)..Number.From(pmLatestDate)}
Now we have a date table with 2,192 consecutive dates from Jan 1, 2015 to Dec 31, 2020, with leap years accounted for automatically for us.
So why did I create a reference from both the Sales and OpenPOs table, and ensure those original table are not loaded? Now I can tweak my date ranges in those original tables, and the dynamic dates will account for it. So if my actual sales table has history going back to 1995, I can filter that in the original sales table to be 2015 and later if I want, and my actual data and Date table will reflect that.
Same thing with my OpenPOs table. I’ve seen companies put fake data, say Dec 31, 2999, for things like blanket POs, or some future forecast, or whatever. I don’t want a date table or actual data going out that far, so I limit it to realistic date ranges in the OpenPOs table with a filter on the Date column.
To load relevant data, I need to create two more references:
Create a reference from Sales, and call it Sales Data.
Create a reference from OpenPOs, and call it Open Purchase Orders.
Makes sure “Enable Load” is checked for both of these.
At this point, in both tables, you can do any further transformations, such as removing columns, grouping data, or whatever you want. Because these transformations are on references to original Sales and OpenPOs table, the original tables are unaffected, and the Date table will be unaffected, which is what you want.
It can help to see how the queries are related to each other. Click on the View tab in Power Query, then Query Dependencies. You should see something similar to this:

You can see how the calculation of the earliest date, pmEarliestDate, and the Sales Data query both come from the original Sales query, but changes in the Sale Data query will not affect the date calculation. You can also see which queries are loaded into Power BI from here, and which have the load disabled.
Finally, I need to enhance the Date table. Right now, it is just dates. But to have rich reporting capabilities, we need things like month names and numbers, quarters, years, etc. I’ll create a few as a place to get started:
Select the Date column in the Date table, then on the Add Columns tab, select Date, Month, Month. This gives us the month number.
Select the Date column, Add Columns, Date, Year, Year.
Select the Date column, Add Columns, Date, Month, Name of Month
You get the idea. Now let’s add a few things that you cannot do through the tool bar. We are going to add a column that will give us the Month and Year in the format of MMM-YY, so Jan-15, Feb-15, Mar-15, etc. This is handy for a number of visuals.
Add Column
Custom Column
Name the column MMM-YY
Type in the following formula:
=Text.Start([Month Name],3) & "-" & Text.End(Text.From([Year]),2)
Make sure to set the type to Text so it isn’t the Any data type (the ABC/123 type)
Now, if you know anything about creating charts or tables in Power BI and Excel, that column will sort alphabetically, which is useless, unless you want April to be before January. Of course you don’t. So we need to create a sorting column for this. Add a new column, call it “MMM-YY Sort” and add this formula:
=[Year]*100 + [Month]
This will create a column that will have 201501, 201502, 201503, etc to correspond to Jan-15, Feb-15, Mar-15, etc. You can use this column to sort your MMM-YY sort. Lastly, change this column to a Whole Number format.
At this point you can add dozens of more columns depending on your date needs. Quarters, weeks, ISO 8601 formatted dates, etc. But in our simple example, this is a really short query, and is fully dynamic. In the Advanced Editor, it would look something like this:
let
    Source = {Number.From(pmEarliestDate)..Number.From(pmLatestDate)},
    #"Converted to Table" = Table.FromList(Source, Splitter.SplitByNothing(), null, null, ExtraValues.Error),
    #"Changed Type" = Table.TransformColumnTypes(#"Converted to Table",{{"Column1", type date}}),
    #"Renamed Columns" = Table.RenameColumns(#"Changed Type",{{"Column1", "Date"}}),
    #"Inserted Month" = Table.AddColumn(#"Renamed Columns", "Month", each Date.Month([Date]), Int64.Type),
    #"Inserted Year" = Table.AddColumn(#"Inserted Month", "Year", each Date.Year([Date]), Int64.Type),
    #"Inserted Month Name" = Table.AddColumn(#"Inserted Year", "Month Name", each Date.MonthName([Date]), type text),
    #"Added MMM-YY" = Table.AddColumn(#"Inserted Month Name", "MMM-YY", each Text.Start([Month Name],3) & "-" & Text.End(Text.From([Year]),2)),
    #"Added MMM-YY Sort" = Table.AddColumn(#"Added MMM-YY", "MMM-YY Sort", each [Year]*100 + [Month]),
    #"Changed Type1" = Table.TransformColumnTypes(#"Added MMM-YY Sort",{{"MMM-YY Sort", Int64.Type}, {"MMM-YY", type text}})
in
    #"Changed Type1"
The final step is once this is loaded, close Power Query and set this as your date table for Power BI:
Make sure automatic date logic is off in Power BI. Select File, Options and Settings, Options, Data Load. Uncheck “Auto Date/Time”. Leaving this checked will create all sorts of unnecessary hidden tables and columns. You’ve created a perfect Date table. Don’t let Power BI’s AI mess this up.
In the Visual view, right-click on the Date table, and select Mark as Date Table, then select the Date column.
It will validate it by ensuring you have no skipped or duplicate dates. Press Ok.
Now you can start creating your visuals, measures, etc. in Power BI, or pivot tables in Excel. As data is updated from your source system, your Date table will dynamically expand. This is handy as you would never have to edit the date range in the table and republish the report. The Power BI service will refresh all of the data, including calculating the ever-expanding date range as sales and purchase orders continue to happen into the future.
Below are the two files I used in my example, the PBIX file and the Excel XLSX file with the sample source data.